Google Doc
Osmosis Diffusion Lab:
Testing Sugars
Laboratory 3, AP Biology
Abstract. In trying to find a cell’s water potential in different molar concentrations and how the concentrations affect a real cell system, we conducted two labs. The real cell system in the second lab was a potato. Adding 20 ml of each solution into separate bags and then weighing their mass gathered the information for the first lab. We then put the bags of each solution into beakers filled with tap water. We weighed their mass after letting them sit for 20-30 minutes. In the second lab, we removed pieces of a sweet potato and weighed their mass. We then added extractions of a sweet potato into different solutions and let them sit for 20-30 minutes. We then weighed the potato extractions after removing them from the solutions. For the final results, the mass of the weighed subjects did increase.
Introduction
Day 1 and 2:
These labs were conducted to explore how different water concentrations can change the mass of an object over time. We initially hypothesized about osmosis before beginning day one’s lab. Our speculations were thoroughly answered by the end of the second day.
Our class had issues with getting consistent results. Our groups’ data was never on similar to the class average. However, other groups that were also conducting the lab had different results also. There were many outliers in these labs. The outliers came from simple mistakes made in the processes of the labs in each day. We are hoping to be able to correct our data as a group and as a class for a more accurate reading.
Methods
Day 1:
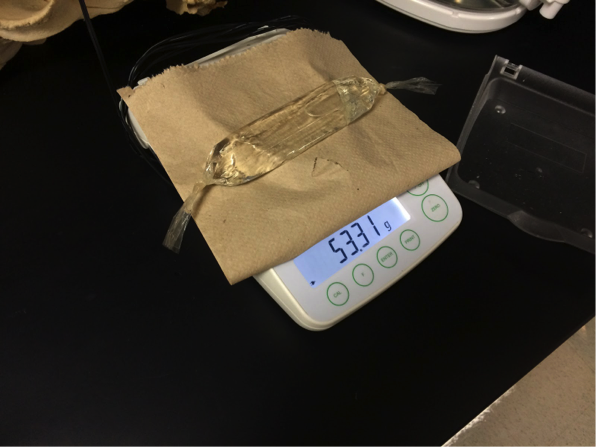
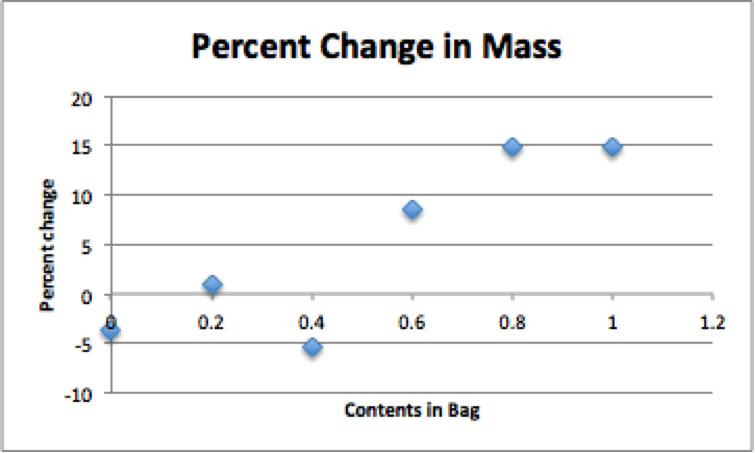
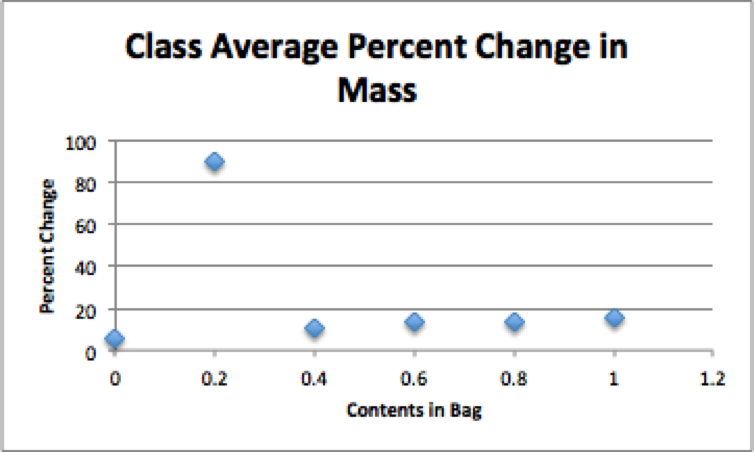
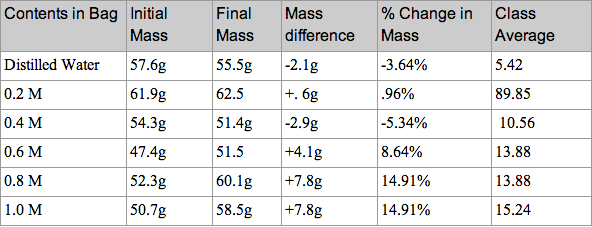
In this lab we tested 6 different studies. To start off we obtained 6 strips of dialysis tubing and tied a knot on one end of each bag. Next we poured 20mL of each of the following solutions into separate bags. Each bag had a different solution in it. The solutions were Distilled Water, 0.4 M sucrose, 0.8 M sucrose, 0.2 M sucrose, 0.6 M sucrose, and 1.0 M sucrose. Next we did our best by removing most of the air from the bag (but still leaving a little bit of space) and then tied the baggie. After rinsing the baggie carefully in tap water to remove any sucrose that may have spilled and carefully blotted them, we recorded the mass of each baggie and record. next we filled six plastic cups with 160-170 mL of tap water and let the bags sit for 20-30 minutes. After 20-30 minutes, we then removed the baggies from the water, carefully blotted them dry and measured the mass of each baggie and record. To calculate the percent change in mass we used the (final mass-initial mass)/ initial mass and then multiplied the answer by 100. Lastly we gathered the data from the other groups in the class and found the class average for each baggie and graphed results as a straight line (use line of best fit).
Day 2:
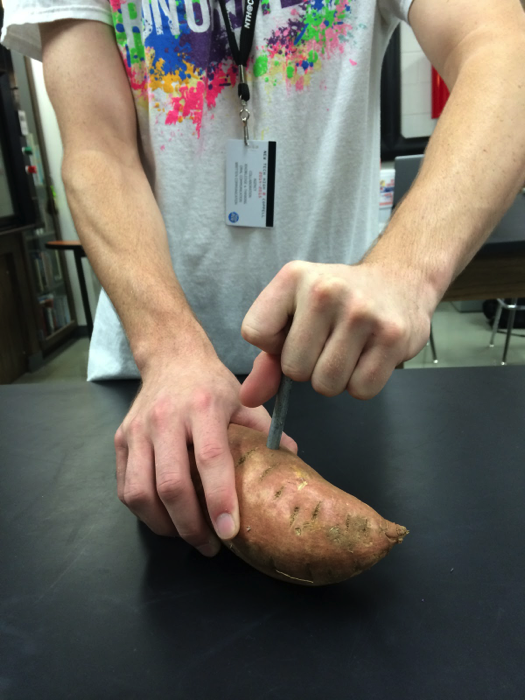
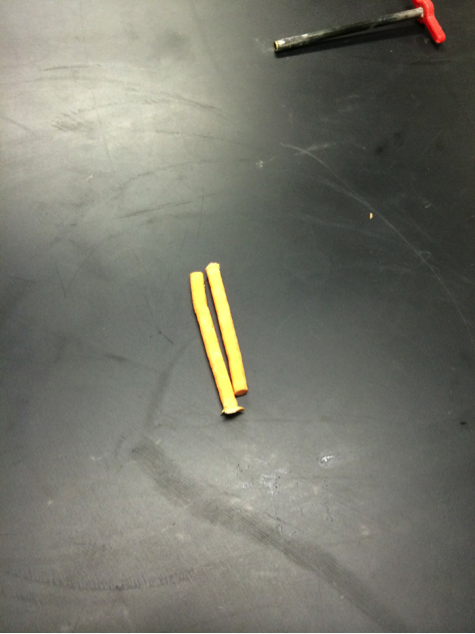
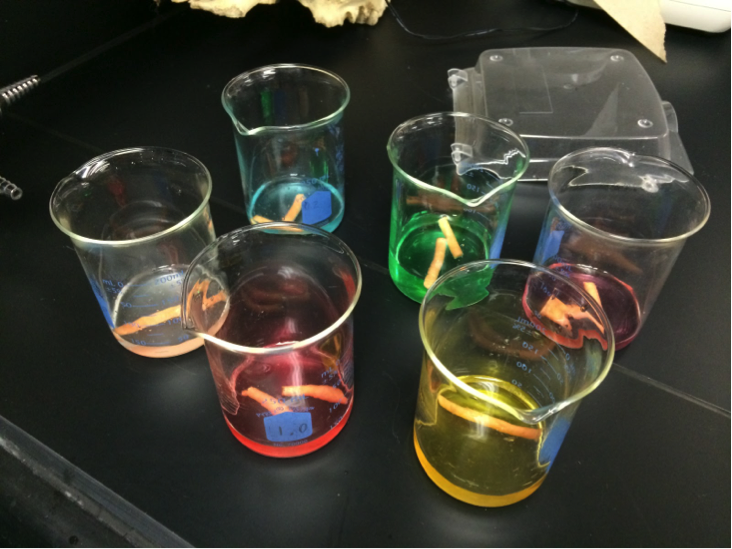
In this lab we had to design an experiment that would identify the concentrations of the sucrose solutions and use the solutions to determine the water potential of the plant tissues. We chose to use sweet potatoes for our experiment. To start of the lab we cut the sweet potatoes into 6 parts and then measured the weight of the potatoes before placing them in the solution. Next, we labeled what potato went in what color. Afterwards, we placed the 6 different slivers within the six different concentrations and waited for 20 minutes. Next, we measured the potatoes after 15-20 minutes. Once we solved for mass difference and percent change, whichever had the least percent change would be the most identical to those of the potatoes. Lastly, we put our final findings on a data chart.
Results
Osmosis Diffusion Lab:
Testing Sugars
Laboratory 3, AP Biology
Abstract. In trying to find a cell’s water potential in different molar concentrations and how the concentrations affect a real cell system, we conducted two labs. The real cell system in the second lab was a potato. Adding 20 ml of each solution into separate bags and then weighing their mass gathered the information for the first lab. We then put the bags of each solution into beakers filled with tap water. We weighed their mass after letting them sit for 20-30 minutes. In the second lab, we removed pieces of a sweet potato and weighed their mass. We then added extractions of a sweet potato into different solutions and let them sit for 20-30 minutes. We then weighed the potato extractions after removing them from the solutions. For the final results, the mass of the weighed subjects did increase.
Introduction
Day 1 and 2:
These labs were conducted to explore how different water concentrations can change the mass of an object over time. We initially hypothesized about osmosis before beginning day one’s lab. Our speculations were thoroughly answered by the end of the second day.
Our class had issues with getting consistent results. Our groups’ data was never on similar to the class average. However, other groups that were also conducting the lab had different results also. There were many outliers in these labs. The outliers came from simple mistakes made in the processes of the labs in each day. We are hoping to be able to correct our data as a group and as a class for a more accurate reading.
Methods
Day 1:
In this lab we tested 6 different studies. To start off we obtained 6 strips of dialysis tubing and tied a knot on one end of each bag. Next we poured 20mL of each of the following solutions into separate bags. Each bag had a different solution in it. The solutions were Distilled Water, 0.4 M sucrose, 0.8 M sucrose, 0.2 M sucrose, 0.6 M sucrose, and 1.0 M sucrose. Next we did our best by removing most of the air from the bag (but still leaving a little bit of space) and then tied the baggie. After rinsing the baggie carefully in tap water to remove any sucrose that may have spilled and carefully blotted them, we recorded the mass of each baggie and record. next we filled six plastic cups with 160-170 mL of tap water and let the bags sit for 20-30 minutes. After 20-30 minutes, we then removed the baggies from the water, carefully blotted them dry and measured the mass of each baggie and record. To calculate the percent change in mass we used the (final mass-initial mass)/ initial mass and then multiplied the answer by 100. Lastly we gathered the data from the other groups in the class and found the class average for each baggie and graphed results as a straight line (use line of best fit).
Day 2:
In this lab we had to design an experiment that would identify the concentrations of the sucrose solutions and use the solutions to determine the water potential of the plant tissues. We chose to use sweet potatoes for our experiment. To start of the lab we cut the sweet potatoes into 6 parts and then measured the weight of the potatoes before placing them in the solution. Next, we labeled what potato went in what color. Afterwards, we placed the 6 different slivers within the six different concentrations and waited for 20 minutes. Next, we measured the potatoes after 15-20 minutes. Once we solved for mass difference and percent change, whichever had the least percent change would be the most identical to those of the potatoes. Lastly, we put our final findings on a data chart.
Results
Discussion
Being able to complete the diffusion and osmosis lab helped us better understand how diffusion (the movement of molecules from a saturated area to a non saturated area) and osmosis (the transportation of water throughout the cell) happens inside of us from the scope of a molecular level. As we begin trying to explain to our intended crowd we need to be able to explain to them how what they are intaking directly correlates with the cell. Passive transports and active transports are a daily occurrence within the human body to merely survive (ie.Converting ATP to energy, consuming O2 expelling CO2, etc.), and the importance as to how all the interactions between the body tie together is one that cannot be overlooked. This lab also helped us understand how the environment of the cell can affect how it works and what could happen to it as a result as a change to its homeostasis. Knowing the difference between a hypotonic solution and hypertonic could be the difference between the retention of too much water or severe dehydration to your cells. Not only that but we also touched based with what would be an isotonic environment for a cell, which is merely a solution that causes no net movement in or out of the cell itself (you could say the cell is in homeostasis with its environment; thus why osmosis does not occur in isotonic solutions).
Conclusion
Day 1 and 2:
The purpose of this lab was to investigate the processes of osmosis and diffusion in a model of a membrane system, as well as, investigating the effects of solute concentration on water potential as it relates to living plant tissues. We are able to conclude that there is in fact sucrose present and that plant cells can be affected by water. Also the potato sample did go up a little in weight and as for the bags we tested initial mass and final mass did vary in mass.
Works Cited
Reece, C. (2014). AP Biology. Pearson.
Wootton, K. (2014). Osmosis Diffusion Notes. Coppell: Wootton, Kim.
Photos and Charts: